Multiple Choice
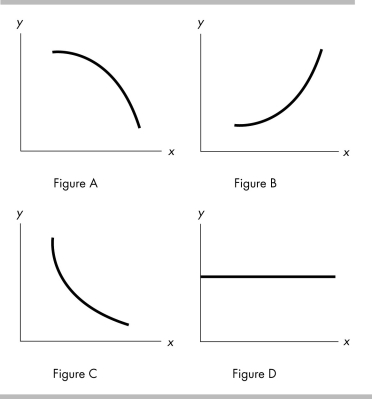
-In the above figure, if there is a negative relationship between the variables x and y, which of the graphs above can be used to indicate this?
A) Figure A
B) Figure B
C) Figure C
D) both Figure A and Figure C
Correct Answer:
Verified
Related Questions
Q303: "As the price of gasoline increases, fewer
Q304: Q305: Along a curve, when one variable increases, Q306: Suppose that we find that student grades Q307: As a firm produces more and more![]()
Unlock this Answer For Free Now!
View this answer and more for free by performing one of the following actions

Scan the QR code to install the App and get 2 free unlocks

Unlock quizzes for free by uploading documents