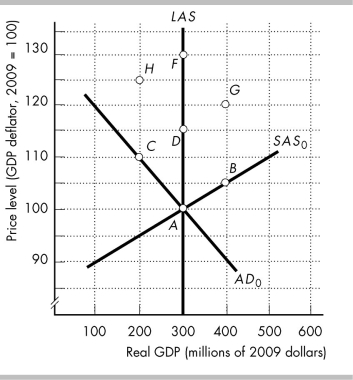
-The figure above shows the initial aggregate demand curve, AD0, the initial short-run aggregate supply curve, SAS0, and the long-run aggregate supply curve, LAS. The points in the figure show possible combinations of real GDP and the price level at which the economy of Atlantia is in macroeconomic equilibrium. The economy is initially at point A. Then, the government increases its expenditure on goods and services. Draw the new aggregate demand and short-run aggregate supply curves in the figure to show the effects of this event on Atlantia's real GDP and price level.
a) What happens to Atlantia's potential GDP?
b) In the short run, what happens to aggregate supply and aggregate demand?
c) What are the new short-run equilibrium real GDP and price level?
d) In the long run, what happens to the short-run aggregate supply and aggregate demand?
e) What are the new long-run equilibrium real GDP and price level?
Correct Answer:
Verified
View Answer
Unlock this answer now
Get Access to more Verified Answers free of charge
Q396: The long-run Phillips curve slopes downward.
Q397: The short-run Phillips curve intersects the long-run
Q398: Stagflation occurs when the SAS curve shifts
Q399: Inflation describes the event of increasing output
Q400: Monetarists believe in changes in animal spirits
Q402: The intertemporal substitution effect is the factor
Q403: The real business cycle theory views fluctuations
Q404: According to the real business cycle theory,
Q405: The real business cycle theory views fluctuations
Q406: The new Keynesian cycle theory views only
Unlock this Answer For Free Now!
View this answer and more for free by performing one of the following actions

Scan the QR code to install the App and get 2 free unlocks

Unlock quizzes for free by uploading documents