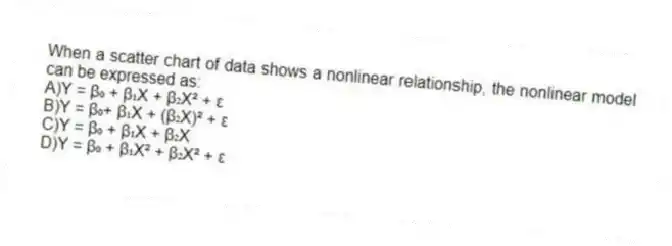
When a scatter chart of data shows a nonlinear relationship, the nonlinear model can be expressed as:
A) Y = β₀ + β₁X + β₂X�² + ε
B) Y = β₀+ β₁X + (β₂X) ² + ε
C) Y = β₀ + β₁X + β₂X
D) Y = β₀ + β₁X² + β₂X² + ε
Correct Answer:
Verified
Q22: Which of the following is true about
Q24: While checking for linearity by examining the
Q25: Which of the following is true about
Q32: In multiple regression, R Square is referred
Q34: When using the t-statistic in multiple regression
Q38: When two or more independent variables in
Q39: Interaction is:
A) the principle of having a
Q49: The best-fitting line maximizes the residuals.
Q51: Use the data given below to
Q55: Interpret the confidence intervals.
Unlock this Answer For Free Now!
View this answer and more for free by performing one of the following actions

Scan the QR code to install the App and get 2 free unlocks

Unlock quizzes for free by uploading documents