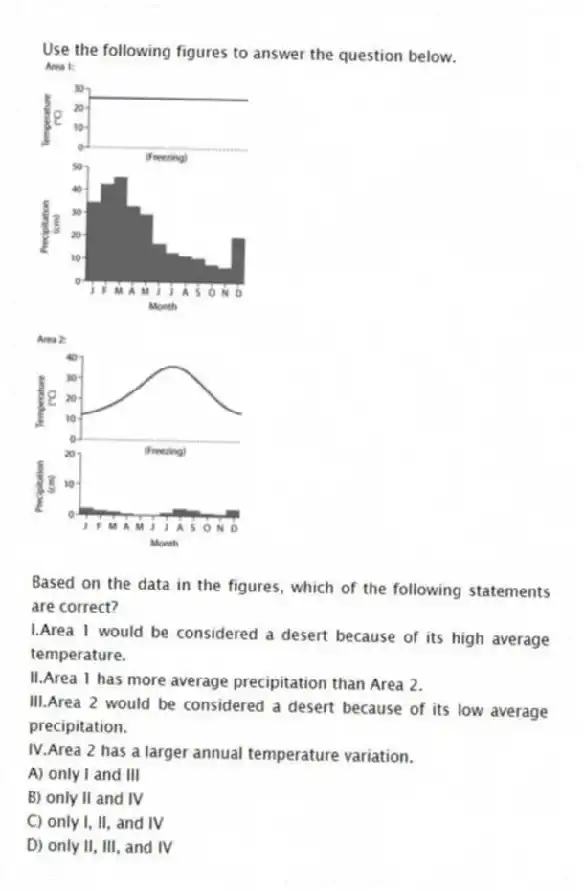
Use the following figures to answer the question below.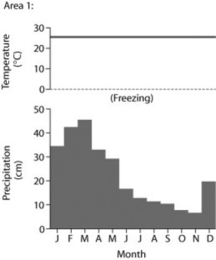
Based on the data in the figures, which of the following statements are correct?
I.Area 1 would be considered a desert because of its high average temperature.
II.Area 1 has more average precipitation than Area 2.
III.Area 2 would be considered a desert because of its low average precipitation.
IV.Area 2 has a larger annual temperature variation.
A) only I and III
B) only II and IV
C) only I, II, and IV
D) only II, III, and IV
Correct Answer:
Verified
Q24: The eight climographs show yearly temperature (line
Q25: The eight climographs show yearly temperature (line
Q25: Which of the following statements best describes
Q26: Use the following figures to answer the
Q26: Which of the following is an important
Q27: Use the following figure to answer the
Q29: The eight climographs show yearly temperature (line
Q30: The eight climographs show yearly temperature (line
Q33: The eight climographs show yearly temperature (line
Q34: Suppose that the number of bird species
Unlock this Answer For Free Now!
View this answer and more for free by performing one of the following actions

Scan the QR code to install the App and get 2 free unlocks

Unlock quizzes for free by uploading documents