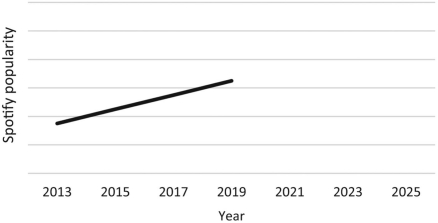
The following is a graph showing an increase in the popularity of the Spotify music streaming service between the years 2013 and 2019.Complete the graph by drawing two lines, one corresponding to what a dialectical person would predict will happen between 2019 and 2025 and one corresponding to what a nondialectical person would predict will happen between 2019 and 2025.
Correct Answer:
Verified
View Answer
Unlock this answer now
Get Access to more Verified Answers free of charge
Q42: Given the cross-cultural research on odor perception,
Q43: Draw a landscape scene containing at least
Q44: Eric and Andy are sitting on a
Q45: A cognitive psychologist is teaching a course
Q46: How might different cultures have come to
Q47: Why is implicit communication more common and
Q48: Your Math professor, Dr.Corey, requires that all
Q49: You are visiting your friend Shirley and
Q51: People who speak _ are more likely
Q52: Which cultural groups are the most likely
Unlock this Answer For Free Now!
View this answer and more for free by performing one of the following actions

Scan the QR code to install the App and get 2 free unlocks

Unlock quizzes for free by uploading documents