Figure: Production Possibilities and Circular-Flow Diagram
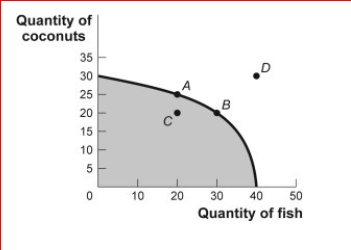
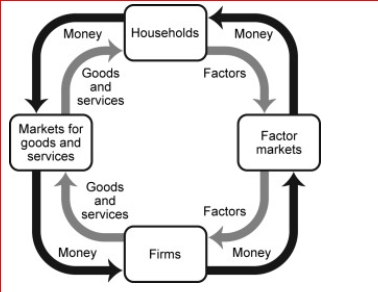
 (Figure: Production Possibilities and Circular-Flow Diagram) Look at the figure Production Possibilities and Circular-Flow Diagram.Assume the two figures represent the same economy.Suppose that in the circular-flow diagram there is a significant decrease in the amount of labor flowing to the firms that produce coconuts.If all other variables remain unchanged, this adjustment in the economy would be best represented in the production possibilities figure by a move from point A toward:
A.point A (no movement would occur).
B.point B (an increase in fish production).
C.point C (a decrease in coconut production).
D.point D (an outward shift of the entire curve).
Correct Answer:
Verified
View Answer
Unlock this answer now
Get Access to more Verified Answers free of charge
Q168: The two flows represented in the circular-flow
Q170: Assume that Colombia gives up three motorcycles
Q171: Which of the following is not a
Q173: Figure: Production Possibilities and Circular-Flow Diagram
(Figure: Production
Q174: Which of the following is an example
Q175: Figure: Production Possibilities and Circular-Flow Diagram
Q176: Which are the two markets represented in
Q187: If LeRoyce trades two cookies for one
Q191: Economists are generally in support of:
A)government restrictions
Q231: Which of the following is a normative
Unlock this Answer For Free Now!
View this answer and more for free by performing one of the following actions

Scan the QR code to install the App and get 2 free unlocks

Unlock quizzes for free by uploading documents