Figure: MSB and MSC of Pollution 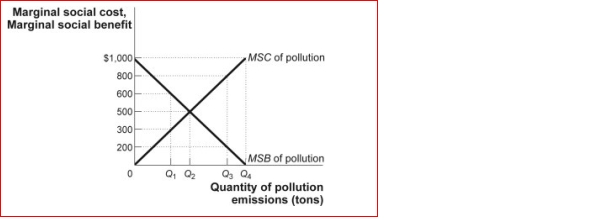 (Figure: MSB and MSC of Pollution) The figure MSB and MSC of Pollution shows the marginal social cost and marginal social benefit of pollution.If the current level of pollution is at Q₁:
A) not enough pollution is being emitted, as the MSB > MSC.
B) not enough pollution is being emitted, as the MSB < MSC.
C) too much pollution is being emitted, as the MSB > MSC.
D) the socially optimal amount of pollution is being emitted, as the MSB = MSC.
Correct Answer:
Verified
Q127: Use the following to answer questions:
Q133: When innovations by one firm are quickly
Q138: Use the following to answer questions:
Q157: Tony has a cell phone, and his
Q158: Q162: Figure: Model of a Competitive Market Q163: Figure: Efficiency and Pollution Q164: Figure: Negative Externalities and Raising Pigs for Q165: Figure: Positive Externalities and the Production of Q166: Figure: Efficiency and Pollution Unlock this Answer For Free Now! View this answer and more for free by performing one of the following actions Scan the QR code to install the App and get 2 free unlocks Unlock quizzes for free by uploading documents![]()
(Figure: Model![]()
![]()

