Figure: MSB and MSC of Pollution 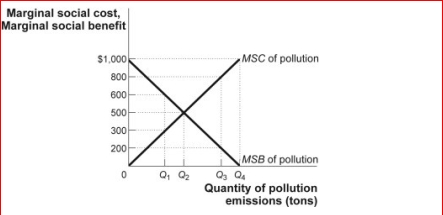
 (Figure: MSB and MSC of Pollution) The figure MSB and MSC of Pollution shows the marginal social cost and marginal social benefit of pollution.What level of pollution represents the socially optimal level?
A) Q₁
B) Q₂
C) Q₃
D) Q4
Correct Answer:
Verified
Q169: Figure: Negative Externalities and Raising Pigs for
Q170: Figure: Efficiency and Pollution Q171: Figure: Efficiency and Pollution Q172: Figure: Model of a Competitive Market Q173: Figure: Efficiency and Pollution Q175: (Figure: MSB and MSC of Pollution) The Q176: Figure: Negative Externalities and Raising Pigs for Q177: Figure: Efficiency and Pollution Q178: Figure: Negative Externalities and Raising Pigs for Q179: Figure: Model of a Competitive Market Unlock this Answer For Free Now! View this answer and more for free by performing one of the following actions Scan the QR code to install the App and get 2 free unlocks Unlock quizzes for free by uploading documents![]()
![]()
![]()
![]()
(Figure: Model

