Figure: The Linear Demand Curve
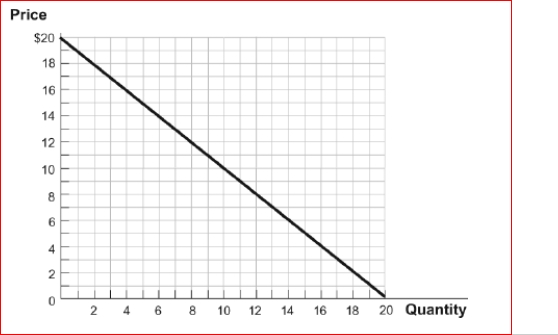 (Figure: The Linear Demand Curve) Look at the figure The Linear Demand Curve.If the price is initially $10, then falls to $9, this will result in a(n):
A.decrease in quantity demanded and a decrease in total revenue.
B.decrease in quantity demanded and an increase in total revenue.
C.increase in quantity demanded and a decrease in total revenue.
D.increase in quantity demanded and an increase in total revenue.
Correct Answer:
Verified
View Answer
Unlock this answer now
Get Access to more Verified Answers free of charge
Q197: A major determinant of the price elasticity
Q203: If the cross-price elasticity of demand between
Q216: If you wanted to make sure that
Q296: The price elasticity of demand is the
Q297: The city government is losing millions of
Q298: A perfectly inelastic demand curve for insulin
Q302: Suppose the cross-price elasticity between two goods
Q303: Figure: The Linear Demand Curve

Q304: All of the following are characteristics of
Q305: The price of a gallon of gasoline
Unlock this Answer For Free Now!
View this answer and more for free by performing one of the following actions

Scan the QR code to install the App and get 2 free unlocks

Unlock quizzes for free by uploading documents