Figure: The Demand Curve for Oil
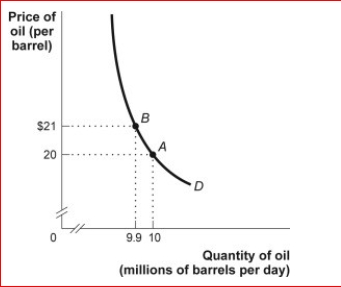
 (Figure: The Demand Curve for Oil) Look at the figure The Demand Curve for Oil.In the figure, demand is price ________ between $20 and $21, since total revenue when
the price _.
A.elastic; increases; decreases
B.inelastic; stays the same; decreases
C.elastic; decreases; increases
D.inelastic; increases; increases
Correct Answer:
Verified
View Answer
Unlock this answer now
Get Access to more Verified Answers free of charge
Q67: If total revenue goes down when the
Q70: If the price of a good increases
Q76: Suppose that an increase in the price
Q109: Yovanka has diabetes and she will pay
Q110: If the University of Michigan increases the
Q112: Figure: Estimating Price Elasticity Q113: Figure: Demand Curves Q115: Which of the following is true about Q116: If the price elasticity of demand is Q118: Figure: Demand Curves Unlock this Answer For Free Now! View this answer and more for free by performing one of the following actions Scan the QR code to install the App and get 2 free unlocks Unlock quizzes for free by uploading documents
![]()
![]()
![]()

