Multiple Choice
Figure: The Demand Curve 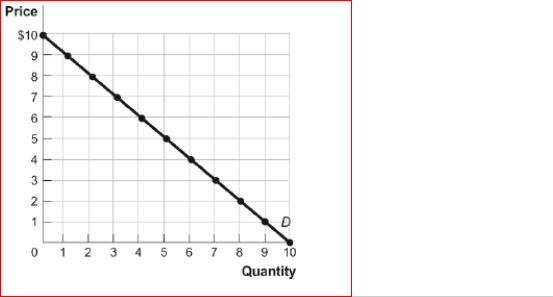 (Figure: The Demand Curve) Look at the figure The Demand Curve.Using the midpoint method, the price elasticity of demand between $8 and $9 is approximately:
A) 0.18.
B) 0.56.
C) 1.8.
D) 5.67.
Correct Answer:
Verified
Related Questions
Q44: Each month Jessica buys exactly 15 Big
Q45: Table: Price Elasticity
(Table: Price Elasticity) Look again
Q46: Table: Price Elasticity Q47: Table: Price Elasticity Q48: Figure: The Demand Curve for Crossings Unlock this Answer For Free Now! View this answer and more for free by performing one of the following actions Scan the QR code to install the App and get 2 free unlocks Unlock quizzes for free by uploading documents![]()
(Table: Price Elasticity) Look again

