This figure is an example of a: 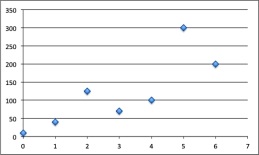
A) line graph.
B) scatterplot.
C) smoothed line graph.
D) bar graph.
Correct Answer:
Verified
Q19: _ is the process of estimating unknown
Q20: The following table from the World Health
Q21: A rising line graph indicates a _
Q22: This figure is an example of a:
Q23: An epidemic is spreading by an average
Q25: The following table shows the number of
Q26: The following table shows the average starting
Q27: The following table shows the percentage of
Q28: A smoothed line graph is made from
Q29: The amount of tax you owe is
Unlock this Answer For Free Now!
View this answer and more for free by performing one of the following actions

Scan the QR code to install the App and get 2 free unlocks

Unlock quizzes for free by uploading documents