To investigate the effect of sleep on basal metabolism, seven college students who averaged seven or more hours of sleep a night (Group A), and five students who averaged less than seven hours of sleep a night (Group B), were examined and their basal metabolism recorded as shown below. 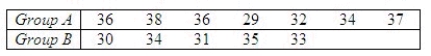 Since it was not clear whether the assumptions for a t-test were valid, the researcher decided to employ nonparametric methods. Use the Wilcoxon rank sum procedure to determine whether the metabolism measurements for Group A are significantly higher than those of Group B. Use
  = 0.05.
The null and alternate hypotheses are as follows:  : The distributions of metabolism measurements for the two groups are identical.
  : The distribution of metabolism measurements for Group B is shifted to the left of Group A. (i.e., the metabolism measurements are lower for Group B)
What is the test statistic?  : ______________
What is the critical value for the test statistic?
______________
Thus: ______________
Conclude:
We ______________ conclude the distribution of metabolism measurements for Group B is lower than those for Group A.
Correct Answer:
Verified
View Answer
Unlock this answer now
Get Access to more Verified Answers free of charge
Q188: Suppose you want to use the Wilcoxon
Q189: The Wilcoxon rank sum test (like most
Q190: Use the Wilcoxon rank sum test on
Q191: Consider the following data set: 2.2, 2.3,
Q192: Because of the rising costs of industrial
Q193: In testing the hypotheses:
H0: The two population
Q194: Given the statistics: n1 = 6, n2
Q196: A vendor was interested in determining whether
Q197: Use the Wilcoxon rank sum test on
Q198: In an investigation of the visual scanning
Unlock this Answer For Free Now!
View this answer and more for free by performing one of the following actions

Scan the QR code to install the App and get 2 free unlocks

Unlock quizzes for free by uploading documents