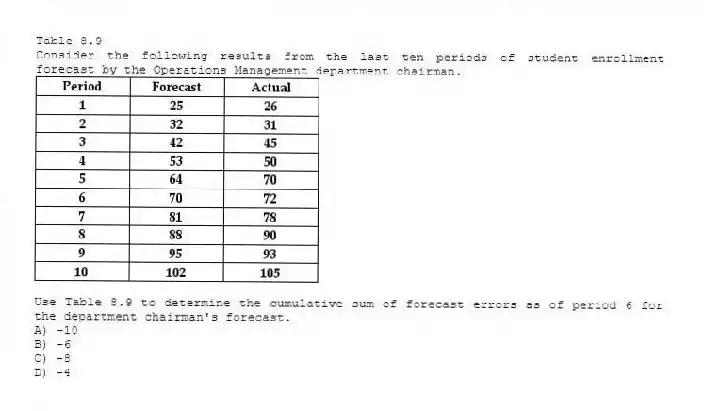
Table 8.9
Consider the following results from the last ten periods of student enrollment forecast by the Operations Management department chairman.
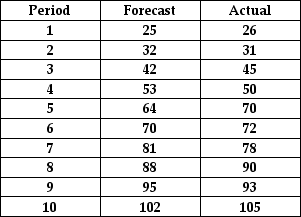
-Use Table 8.9 to determine the cumulative sum of forecast errors as of period 6 for the department chairman's forecast.
A) -10
B) -6
C) -8
D) -4
Correct Answer:
Verified
Q114: Graph 8.1
Data plotted in the graph appear
Q115: Graph 8.1
Data plotted in the graph appear
Q116: Table 8.7
A sales manager wants to forecast
Q117: Table 8.5 Q118: Table 8.7 Q120: Table 8.7 Q121: Calculate three forecasts using the following data. Q122: Table 8.8 Q123: A forecasting system that brings the manufacturer Q124: Focus forecasting selects the best forecast from
![]()
A sales manager wants to forecast
A sales manager wants to forecast
The manager of a pizza shop
Unlock this Answer For Free Now!
View this answer and more for free by performing one of the following actions

Scan the QR code to install the App and get 2 free unlocks

Unlock quizzes for free by uploading documents