The following dashboard visualizes simulated sensors from the PubNub simulated IoT sensors stream: 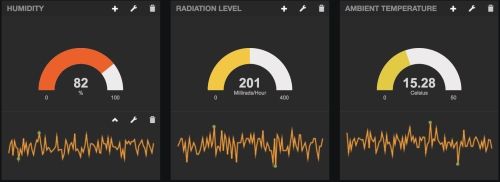 For each sensor, the visualization shows a Gauge (the semicircular visualizations) and a ________ (the jagged lines) to visualize the data.
A) Sparkleline
B) Glowline
C) Sparkline
D) None of the above
Correct Answer:
Verified
Q59: Which of the following statements a), b)
Q60: Which of the following statements a), b)
Q61: Which of the following statements is false?
A)
Q62: Which of the following statements a), b)
Q63: Every RDD has access to the current
Q65: When you subscribe to a PubNub stream,
Q66: Which of the following statements a), b)
Q67: StreamingContext's _ method begins the streaming process.
A)
Q68: Which of the following statements a), b)
Q69: Which of the following statements reflect security,
Unlock this Answer For Free Now!
View this answer and more for free by performing one of the following actions

Scan the QR code to install the App and get 2 free unlocks

Unlock quizzes for free by uploading documents