The following figure shows the graph of the velocity, v, of an object (in meters/sec) . If the graph were shifted up 4 units, how would the distance traveled between t = 0 and t = 6 change? 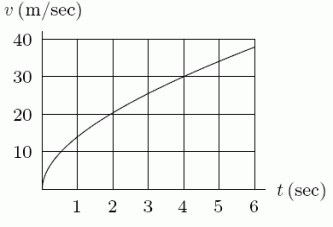
A) It would increase by 4 meters.
B) It would decrease by 4 meters.
C) It would increase by 24 meters.
D) It would decrease by 24 meters.
E) It would remain the same.
Correct Answer:
Verified
Q4: The flow rate of water in a
Q5: The rate of pollution pouring into a
Q6: Consider a sports car which accelerates from
Q7: Use a calculator to evaluate 
Q8: Use a calculator to evaluate
Q10: At time t, in seconds, the velocity
Q11: Two cars start at the same time
Q12: Your velocity, in meters per second, is
Q13: The graph below shows the velocity of
Q14: At time t, in seconds, your velocity,
Unlock this Answer For Free Now!
View this answer and more for free by performing one of the following actions

Scan the QR code to install the App and get 2 free unlocks

Unlock quizzes for free by uploading documents