Short Answer
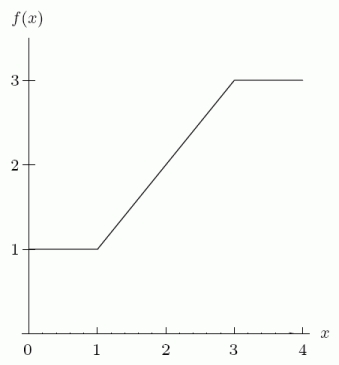
The following figure shows the graph of  . If
. If  and
and  , find
  .
. 
Correct Answer:
Verified
Related Questions
Q112: Given the following graph of 
Q113: Calculate Q114: The following graph represents the rate of Q115: The following figure shows the graph of Q116: Using the following figure, find Q117: Q118: The following figure shows the graph of Q119: Given the values of Q121: Use integration by parts to find Q122: Use integration by parts to find ![]()
![]()
Unlock this Answer For Free Now!
View this answer and more for free by performing one of the following actions

Scan the QR code to install the App and get 2 free unlocks

Unlock quizzes for free by uploading documents