Cost and revenue functions are graphed in the first figure. What does the second figure show? 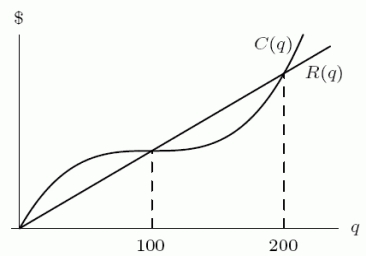
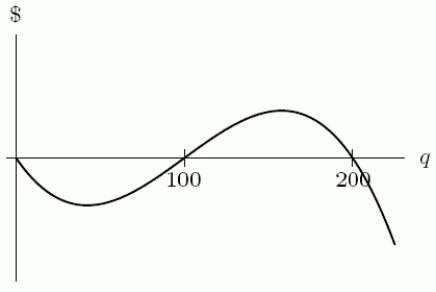
A) Total profit
B) Marginal cost
C) Marginal revenue
Correct Answer:
Verified
Q85: A newspaper headline recently read , "
Q86: Your friend Herman operates a neighborhood lemonade
Q87: The graph of a cost function is
Q88: Cost and revenue functions for a certain
Q89: Cost and revenue functions for a certain
Q91: To produce 250 items the total cost
Q92: Given the following table, find MC(2).
Q93: Given the following table, find 
Q94: The following table gives the cost and
Q95: Cost and revenue functions for a certain
Unlock this Answer For Free Now!
View this answer and more for free by performing one of the following actions

Scan the QR code to install the App and get 2 free unlocks

Unlock quizzes for free by uploading documents