The graph shown displays various price and output levels in an economy. 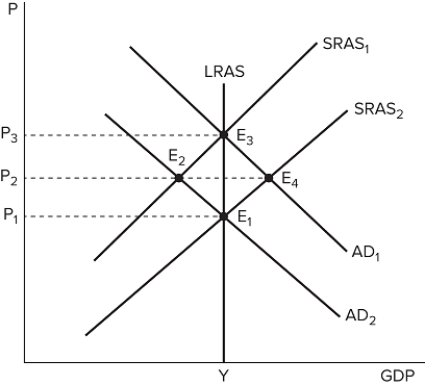 If the economy is currently at point E3, it must be in:
A) long-run equilibrium.
B) a recession.
C) an economic expansion.
D) an economic recovery.
Correct Answer:
Verified
Q50: The graph shown displays various price and
Q51: The velocity of money is:
A) the number
Q52: If an economy produces 3,000 units of
Q53: If an economy produces 2,000 units of
Q54: The idea that the value of money
Q56: According to the quantity theory of money,
Q57: The number of transactions a typical dollar
Q58: If an economy produces 4,000 units of
Q59: The quantity theory of money explicitly states
Q60: If an economy produces 1,000 units of
Unlock this Answer For Free Now!
View this answer and more for free by performing one of the following actions

Scan the QR code to install the App and get 2 free unlocks

Unlock quizzes for free by uploading documents