(Figure: Crop Yield and Fertilizer) The graph shows a hypothetical relationship between tons of fertilizer used and crop yields. Which statement is NOT correct? 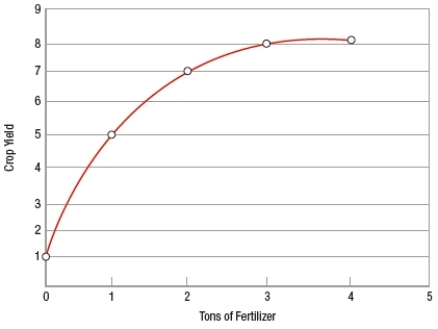
A) The slope of the curve between 1 and 2 tons of fertilizer is approximately 2.
B) The relationship between fertilizer usage and yield is nonlinear.
C) Because the relationship is nonlinear, it is difficult to create an economic model describing the relationship between the two variables.
D) Using more than 3 tons of fertilizer has minimal effect on yield.
Correct Answer:
Verified
Q71: (Figure: Graph Examples) Which graph is an
Q72: The answers to normative questions
A) are the
Q73: Government policy to achieve high employment may
Q74: Consider the equation Y = e +
Q75: Macroeconomics is concerned about the broader issues
Q77: Most economists agree that there is no
Q78: In the equation Y = e +
Q79: Macroeconomics studies the outcomes of individual markets
Q80: A store sells one candy bar for
Q81: The main difference between macroeconomics and microeconomics
Unlock this Answer For Free Now!
View this answer and more for free by performing one of the following actions

Scan the QR code to install the App and get 2 free unlocks

Unlock quizzes for free by uploading documents