Multiple Choice
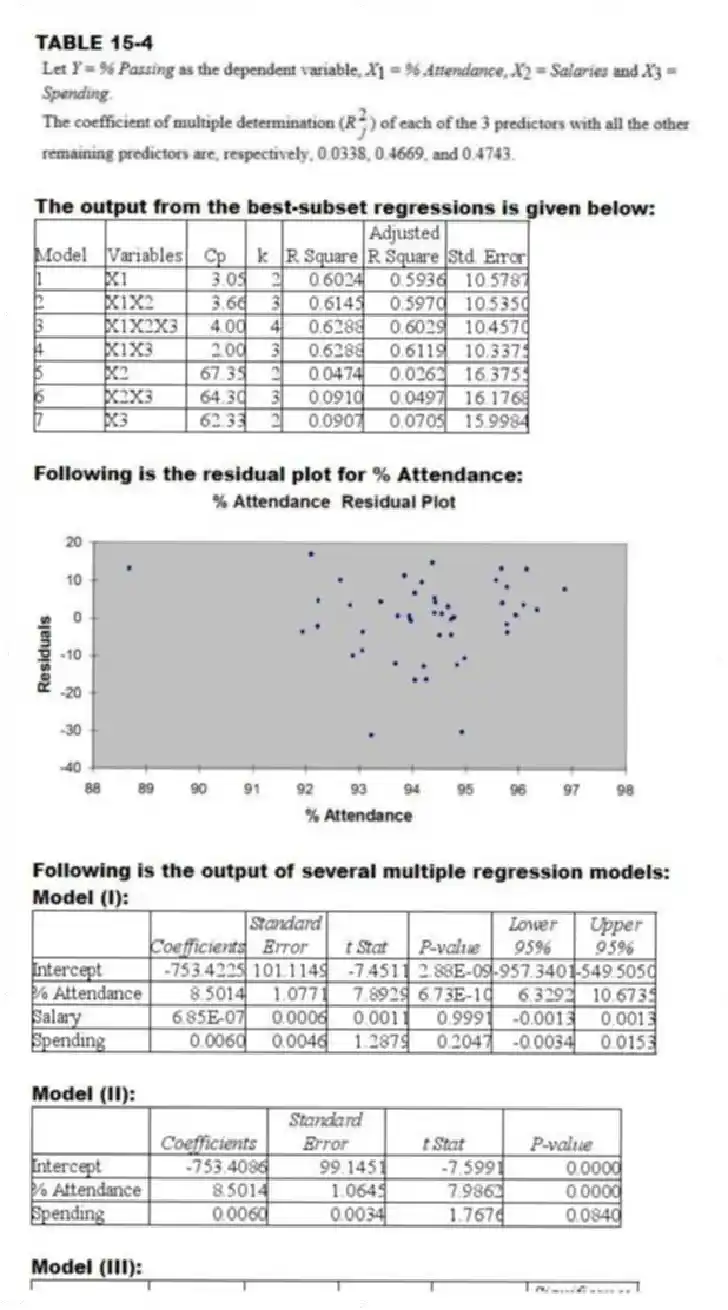
TABLE 15-4

The output from the best-subset regressions is given below:

Following is the residual plot for % Attendance:

Following is the output of several multiple regression models:
Model (I) :

Model (II) :

Model (III) :

-Referring to Table 15-4, the "best" model chosen using the adjusted R-square statistic is
A) X₁,X₃.
B) X₁,X₂,X₃.
C) Either of the above
D) None of the above
Correct Answer:
Verified
Related Questions
Q22: In stepwise regression,an independent variable is not
Q26: A regression diagnostic tool used to study
Q29: The logarithm transformation can be used
A)to overcome
Q36: The goals of model building are to
Q38: The stepwise regression approach takes into consideration

