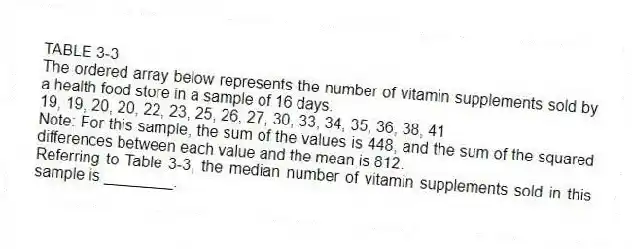
TABLE 3-3
The ordered array below represents the number of vitamin supplements sold by a health food store in a sample of 16 days.
19, 19, 20, 20, 22, 23, 25, 26, 27, 30, 33, 34, 35, 36, 38, 41
Note: For this sample, the sum of the values is 448, and the sum of the squared differences between each value and the mean is 812.
-Referring to Table 3-3, the median number of vitamin supplements sold in this sample is ________.
Correct Answer:
Verified
Q57: The median of a data set with
Q61: TABLE 3-2
The data below represent the amount
Q61: The interquartile range is a measure of
Q62: TABLE 3-3
The ordered array below represents the
Q63: TABLE 3-2
The data below represent the amount
Q64: If the data set is approximately bell-shaped,the
Q65: TABLE 3-3
The ordered array below represents the
Q67: TABLE 3-2
The data below represent the amount
Q68: TABLE 3-2
The data below represent the amount
Q73: The coefficient of variation is a measure
Unlock this Answer For Free Now!
View this answer and more for free by performing one of the following actions

Scan the QR code to install the App and get 2 free unlocks

Unlock quizzes for free by uploading documents