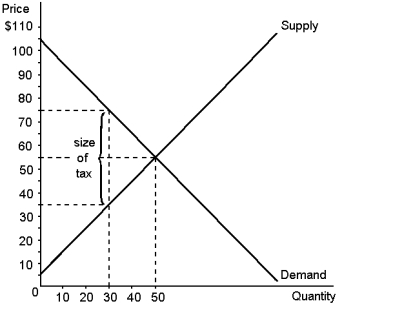
Using the graph below, determine each of the following:
a. equilibrium price before the tax
b. consumer surplus before the tax
c. producer surplus before the tax
d. total surplus before the tax
e. consumer surplus after the tax
f. producer surplus after the tax
g. total tax revenue
h. total surplus (consumer surplus + producer surplus + tax revenue) after the tax
i. deadweight loss
Correct Answer:
Verified
b. $1250
c. $...
View Answer
Unlock this answer now
Get Access to more Verified Answers free of charge
Q83: Use the graph below to fill in
Q85: According to the information provided, what will
Q87: Suppose that instead of a supply-demand diagram,
Q106: Taxes on labour encourage all of the
Q110: The less freedom people are given to
Q116: The Laffer curve:
A)relates income tax rates to
Q120: If the supply of land is fixed,
Q122: How is the deadweight loss of a
Q131: Using demand-supply diagrams, show the difference in
Q133: What factors must be taken into account
Unlock this Answer For Free Now!
View this answer and more for free by performing one of the following actions

Scan the QR code to install the App and get 2 free unlocks

Unlock quizzes for free by uploading documents