In the following figure, f(t) gives the population P1 of a certain bacteria culture at time t after a portion of bactericide A was introduced into the population at t = 0. The graph of g gives the population P2 of a similar bacteria culture at time t after a portion of bactericide B was introduced into the population at t = 0.
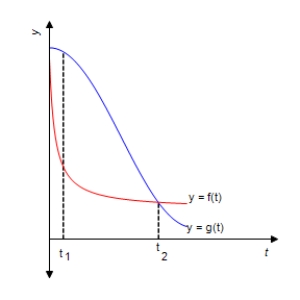
Which population is decreasing faster at t1?
Population __________
Which population is decreasing faster at t2?
Population __________
Which bactericide is more effective in reducing the population of bacteria in the short run?
Bactericide __________
Which bactericide is more effective in reducing the population of bacteria in the long run?
Bactericide __________
Correct Answer:
Verified
Q26: Let Q27: Find the indicated one-sided limit. Q28: Let Q29: Use the four-step process to find the Q30: Use the four-step process to find the Q32: The graph shows the volume of wood Unlock this Answer For Free Now! View this answer and more for free by performing one of the following actions Scan the QR code to install the App and get 2 free unlocks Unlock quizzes for free by uploading documents![]()
![]()

