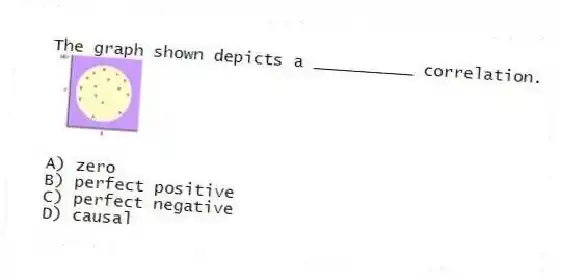
The graph shown depicts a __________ correlation.
A) zero
B) perfect positive
C) perfect negative
D) causal
Correct Answer:
Verified
Q521: A correlation coefficient of -1.09 indicates a(n)
A)strong
Q528: Which of the following coefficients of correlation
Q529: A correlation coefficient of .05 indicates a(n)
A)weak
Q530: A teacher states that the students who
Q531: If a correlational relationship is perfect ,
Q538: Correlations allow us to
A)control behavior.
B)explain behavior.
C)predict behavior.
D)establish
Q539: Which of the following coefficients of correlation
Q643: Simister and Cooper decided to find out
Q649: A correlational coefficient is best characterized as
Q650: The graph shown depicts a _ correlation.
Unlock this Answer For Free Now!
View this answer and more for free by performing one of the following actions

Scan the QR code to install the App and get 2 free unlocks

Unlock quizzes for free by uploading documents