In the following graph, S and D represent the supply and demand curves, respectively, in the labour market. Refer to the graph to answer the question. 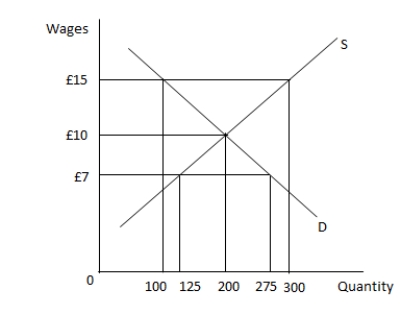 The labour market is in equilibrium when _____ workers are employed.
A) 200
B) 100
C) 300
D) 275
Correct Answer:
Verified
Q52: In the following graph, S and D
Q53: Which of the following is an instrument
Q54: Which of the following is true for
Q55: Suppose the demand for construction jobs declines
Q56: The unemployment that resulted when the typewriter
Q58: The Phillips curve shows the relationship between:
A)
Q59: Which of the following is a key
Q60: Which of the following types of unemployment
Q61: Menu costs are the costs of changing
Q62: The difference between frictional unemployment and cyclical
Unlock this Answer For Free Now!
View this answer and more for free by performing one of the following actions

Scan the QR code to install the App and get 2 free unlocks

Unlock quizzes for free by uploading documents