Construct an R chart and determine whether the process variation is within statistical control. 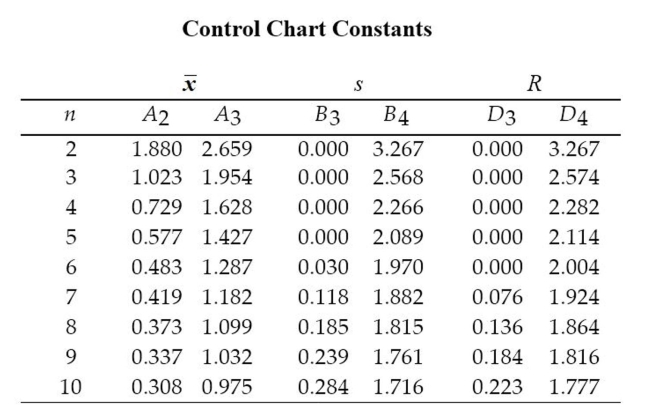 A machine that is supposed to fill small bottles to contain 20 milliliters yields the following data from a test of 4 bottles
every hour. 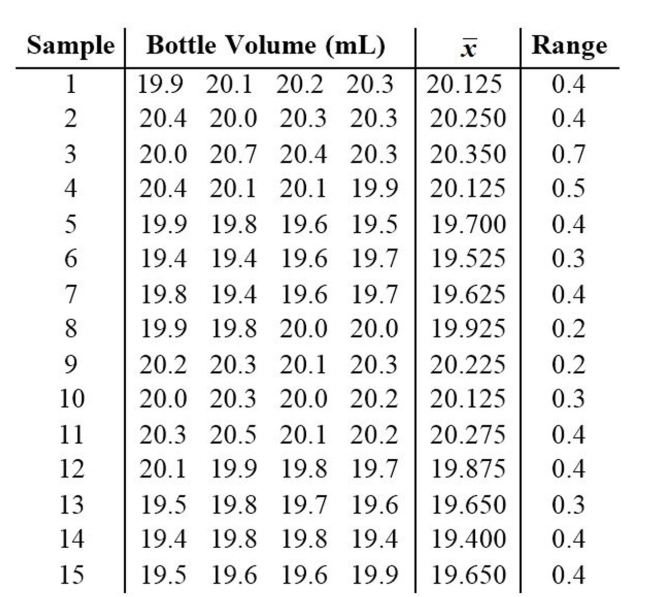
Correct Answer:
Verified
Q1: Construct an R chart and determine whether
Q2: A common goal of quality control is
Q4: A control chart for
Q6: Define statistically stable (or "within statistical control").
Q6: Examine the given run chart or control
Q7: A control chart for R is shown
Q8: Are control charts based on actual behavior
Q12: Describe an R chart and give an
Q15: Sketch a control chart that indicates that
Q18: Describe a run chart and give an
Unlock this Answer For Free Now!
View this answer and more for free by performing one of the following actions

Scan the QR code to install the App and get 2 free unlocks

Unlock quizzes for free by uploading documents