The following data show the number of laps run by each participant in a marathon. Which of these choices display the correct stemplot?
A) 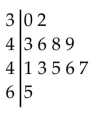
B) 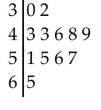
Correct Answer:
Verified
Q8: A nurse measured the blood pressure of
Q9: A nurse measured the blood pressure of
Q10: The scatterplot below displays the amount
Q11: The two key parts of a regression
Q12: Identify the cumulative frequency distribution that
Q14: The following frequency distribution analyzes the
Q15: Which choice displays the best graphic
Q16: Analysis of the data from 25 mothers
Q17: A nurse measured the blood pressure of
Q18:
Unlock this Answer For Free Now!
View this answer and more for free by performing one of the following actions

Scan the QR code to install the App and get 2 free unlocks

Unlock quizzes for free by uploading documents