The following tables present the number of specimens that tested positive for Type A and Type B influenza in the United States during the first 15 weeks of a recent flu season. 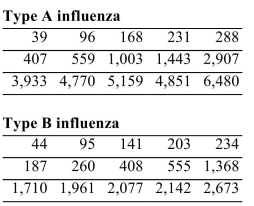
Find the median number of type A and type B cases in the first 15 weeks of the flu season.
A) Type A: 1,078
Type B: 469
B) Type A: 1,003
Type B: 408
C) Type A: 1,546
Type B: 1,546
D) Type A: 2,156
Type B: 937
Correct Answer:
Verified
Q35: A student has an average of 79
Q36: The table below lists the populations,
Q37: A data set has a median of
Q38: A data set contains three unique values.
Q39: Find the population variance for the
Q41: A population has a mean μ
Q42: Approximate the sample variance given the
Q43: For the data set below, find
Q44: A paint manufacturer discovers that the mean
Q45: Approximate the population standard deviation given
Unlock this Answer For Free Now!
View this answer and more for free by performing one of the following actions

Scan the QR code to install the App and get 2 free unlocks

Unlock quizzes for free by uploading documents