The following tables present the number of specimens that tested positive for Type A and Type B influenza in the United States during the first 15 weeks of a recent flu season. 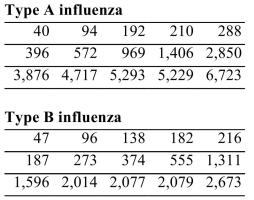
Find the mean number of type A and type B cases in the first 15 weeks of the flu season.
A) Type A: 2,190
Type B: 921
B) Type A: 1,095
Type B: 461
C) Type A: 1,556
Type B: 1,556
D) Type A: 969
Type B: 374
Correct Answer:
Verified
Q24: The following data represent the total
Q25: The following data represent the ice
Q26: Find the sample variance for the
Q27: Elizabeth worked at three part-time jobs last
Q28: The following data represent the total
Q30: The table below lists the populations,
Q31: The following table presents the number
Q32: A data set has a median of
Q33: In Steve's statistics class, the final grade
Q34: Find the population standard deviation for
Unlock this Answer For Free Now!
View this answer and more for free by performing one of the following actions

Scan the QR code to install the App and get 2 free unlocks

Unlock quizzes for free by uploading documents