The scatter plots of different data are shown below. Determine whether there is a positive correlation, negative correlation, or no discernible correlation between the variables.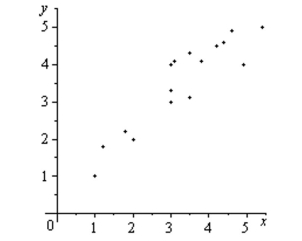
A) positive correlation
B) negative correlation
C) no discernible correlation
Correct Answer:
Verified
Q90: Write the slope-intercept form of the
Q91: Use the graph of
Q92: Find the domain of the function.
Q93: Compare the graph of the following
Q94: Determine an equation that may represented
Q96: Use function notation to write
Q97: Does the table describe a function?
Q98: Show algebraically that the functions
Q99: Match the graph of the function shown
Q100: Determine the domain and range of
Unlock this Answer For Free Now!
View this answer and more for free by performing one of the following actions

Scan the QR code to install the App and get 2 free unlocks

Unlock quizzes for free by uploading documents