The following histogram represents the movie runtimes (length of a movie in minutes) of 489 movies. What is the typical movie runtime according to this distribution? 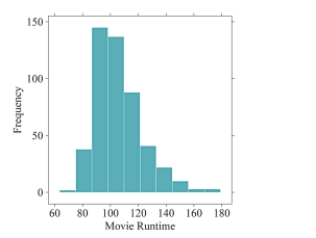
A) The typical value is about 90.
B) The typical value is about 100.
C) The typical value is about 120.
D) The typical value is about 130.
Correct Answer:
Verified
Q19: Using the following bar chart, what can
Q20: What is the difference between a bar
Q21: Which dotplot represents the same data as
Q22: The bar charts below depict the marital
Q23: When examining distributions of numerical data, what
Q25: In the following histogram, what can you
Q26: for following questions , match one of
Q27: What does it mean to find the
Q28: for following questions , match one of
Q29: How are individual observations recorded in a
Unlock this Answer For Free Now!
View this answer and more for free by performing one of the following actions

Scan the QR code to install the App and get 2 free unlocks

Unlock quizzes for free by uploading documents