Which scatterplot below depicts a stronger linear relationship? Why? 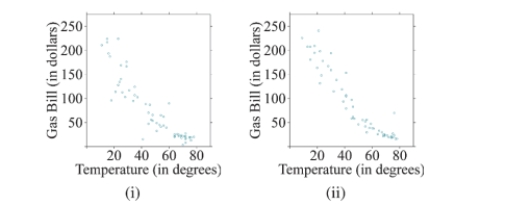
A) Scatterplot (i) shows a stronger linear relationship because it has less vertical variation between points.
B) Scatterplot (i) shows a stronger linear relationship because it has more vertical variation between points.
C) Scatterplot (ii) shows a stronger linear relationship because it has less vertical variation between points.
D) Scatterplot (ii) shows a stronger linear relationship because it has more vertical variation between points.
Correct Answer:
Verified
Q32: Use the following information for following questions
Q33: Suppose the ages and heights of 100
Q34: Use the following information for following questions
Q35: Use the following information to answer Questions
Q36: Use the following regression equation regarding car
Q38: Suppose daily high and low temperature measures
Q39: A study about high school student SAT
Q40: Which of the following scatterplots shows data
Q41: Given the following scatterplot, if the point
Q42: For any set of data, the regression
Unlock this Answer For Free Now!
View this answer and more for free by performing one of the following actions

Scan the QR code to install the App and get 2 free unlocks

Unlock quizzes for free by uploading documents