The graph below shows the percentage of students enrolled in the College of Engineering at State University. Use the graph to answer the question. 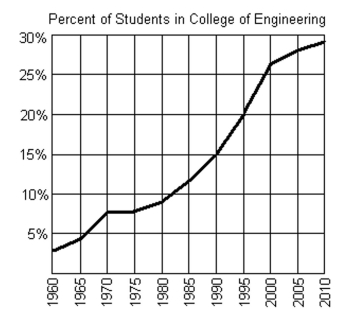
-If f(x) = 20%, what year is represented by x?
A) 2000
B) 1985
C) 1995
D) 1990
Correct Answer:
Verified
Q41: Use the graph to identify domain
Q42: Use the vertical line test to determine
Q43: Use the graph to find the indicated
Q44: Find the domain of the function.
-
Q45: The graph below shows the percentage of
Q47: Use the graph to find the indicated
Q48: Use the vertical line test to determine
Q49: Use the vertical line test to determine
Q50: The graph below shows the percentage of
Q51: Use the vertical line test to determine
Unlock this Answer For Free Now!
View this answer and more for free by performing one of the following actions

Scan the QR code to install the App and get 2 free unlocks

Unlock quizzes for free by uploading documents