Draw and Interpret Boxplots
-The boxplot shown below was constructed in Excel for the amount of soda that was poured by a filling machine into 12-ounce soda cans at a local bottling company. 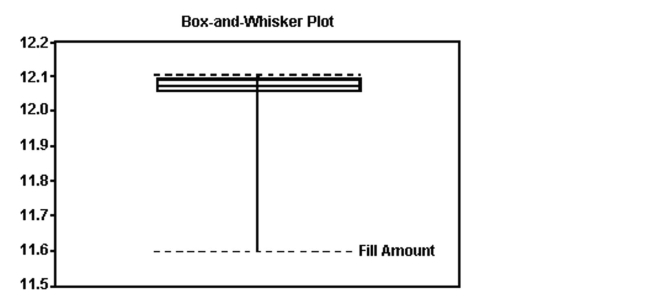 Based on the information given in the boxplot below, what shape do you believe the data to have
A) skewed to the left
B) approximately symmetric
C) skewed to the right
D) cannot be determined
Correct Answer:
Verified
Q110: The percentage of measurements that are above
Q137: Determine and Interpret z-Scores
-A television station
Q138: Choose the one alternative that best completes
Q140: Provide an appropriate response.
-To study the
Q141: Provide an appropriate response.
-Given the following
Q143: Provide an appropriate response.
-The normal monthly
Q144: Provide an appropriate response.
-The following is
Q145: Provide an appropriate response.
-Eleven high school teachers
Q146: Provide an appropriate response.
-An Excel printout
Q147: Draw and Interpret Boxplots
-A survey of 200
Unlock this Answer For Free Now!
View this answer and more for free by performing one of the following actions

Scan the QR code to install the App and get 2 free unlocks

Unlock quizzes for free by uploading documents