Find the area of the shaded region. The graph depicts the standard normal distribution wit? mean 0 and standard deviation 1. 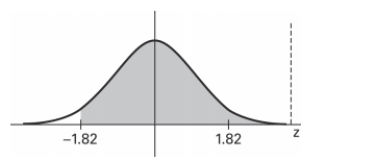
A)
B)
C)
D)
Correct Answer:
Verified
Q22: The given values are discrete. Use the
Q29: In a population of 210 women,
Q30: Find the indicated z score. The
Q30: Which of the following is a biased
Q31: A coin is tossed 20 times. A
Q35: In one region, the September energy consumption
Q36: Assume that the red blood cell counts
Q36: If
Q37: Assume that the red blood cell counts
Q39: An unbiased estimator is a statistic that
Unlock this Answer For Free Now!
View this answer and more for free by performing one of the following actions

Scan the QR code to install the App and get 2 free unlocks

Unlock quizzes for free by uploading documents