Examine the given run chart or control chart and determine whether the process is within statistical control. 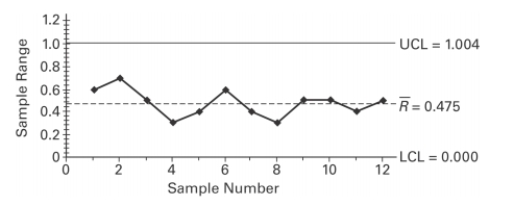
A) The process is within statistical control.
B) The process is not within statistical control.
Correct Answer:
Verified
Q3: List the advantages and disadvantages of nonparametric
Q45: A _ is a sequential plot of
Q55: Which of the following is not one
Q55: Which graph using individual data values
Q56: Which type of chart would be
Q57: Use the given process data to
Q61: Use a 0.05 level of significance
Q63: Use the Wilcoxon rank-sum test to
Q65: Use the Wilcoxon rank-sum test to
Q68: Use the rank correlation coefficient to test
Unlock this Answer For Free Now!
View this answer and more for free by performing one of the following actions

Scan the QR code to install the App and get 2 free unlocks

Unlock quizzes for free by uploading documents