A run chart for individual values is shown below. Does there appear to be a pattern suggesting
that the process is not within statistical control? If so, describe the pattern. 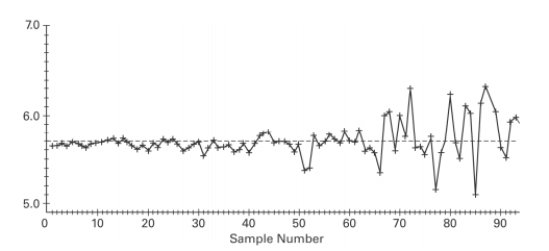
Correct Answer:
Verified
View Answer
Unlock this answer now
Get Access to more Verified Answers free of charge
Q34: Construct an R chart and determine
Q35: A control chart for
Q36: A control chart for
Q37: Examine the given run chart or control
Q38: Describe a p chart and give an
Q40: A control chart for
Q41: Examine the given run chart or control
Q42: A machine that is supposed to
Q44: Use the given process data to
Q49: The centerline for a control chart for
Unlock this Answer For Free Now!
View this answer and more for free by performing one of the following actions

Scan the QR code to install the App and get 2 free unlocks

Unlock quizzes for free by uploading documents