Construct a scatter diagram for the given data
- 
A) 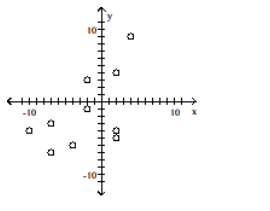
B) 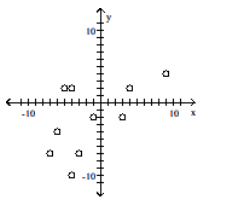
C) 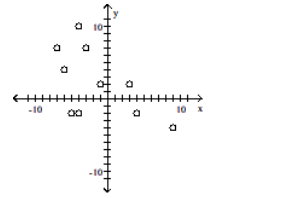
D) 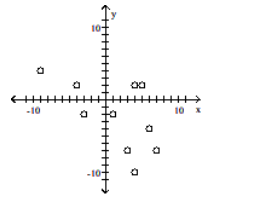
Correct Answer:
Verified
Q1: Construct a scatter diagram for the
Q2: Given the linear correlation coefficient r
Q3: Provide an appropriate response.
-Explain why having a
Q4: Provide an appropriate response.
-Suppose data are collected
Q6: Given the linear correlation coefficient r
Q7: Provide an appropriate response.
-
Q8: Provide an appropriate response.
-Discuss the guidelines under
Q9: Provide an appropriate response.
-Create a scatterplot that
Q11: Provide an appropriate response.
-Suppose that statisticians determine
Q55: Describe what scatterplots are and discuss the
Unlock this Answer For Free Now!
View this answer and more for free by performing one of the following actions

Scan the QR code to install the App and get 2 free unlocks

Unlock quizzes for free by uploading documents