Use the given process data to construct a control chart for p
-A run chart for individual values is shown below. Does there appear to be a pattern suggesting that the process is not within statistical control? If so, describe the pattern. 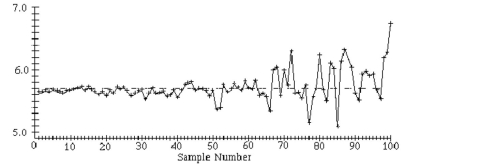
Correct Answer:
Verified
View Answer
Unlock this answer now
Get Access to more Verified Answers free of charge
Q21: Use the given process data to construct
Q22: Use the given process data to
Q23: Solve the Problem.
-A control chart for
Q24: Use the given process data to construct
Q25: Solve the Problem.
-An
Q27: Use the given process data to
Q28: Solve the Problem.
-A control chart for attributes
Q29: Use the given process data to
Q30: Use the given process data to construct
Q31: Use the given process data to
Unlock this Answer For Free Now!
View this answer and more for free by performing one of the following actions

Scan the QR code to install the App and get 2 free unlocks

Unlock quizzes for free by uploading documents