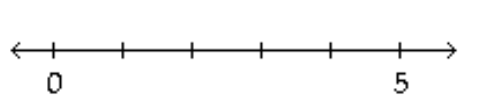
Construct the dot plot for the given data.
-The frequency chart shows the distribution of defects for the machines used to produce a product.
A) 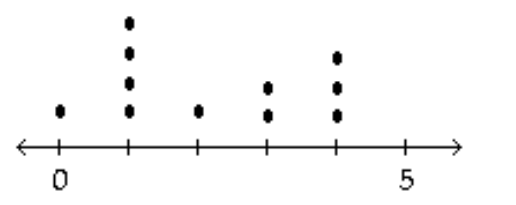
B) 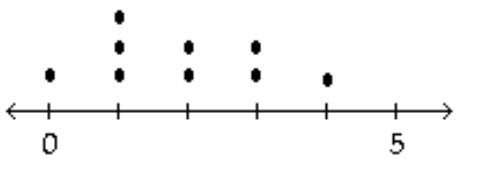
C) 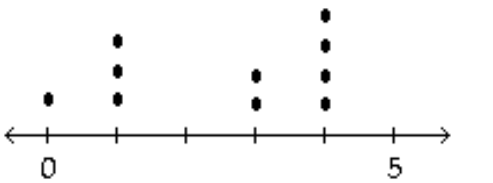
D) 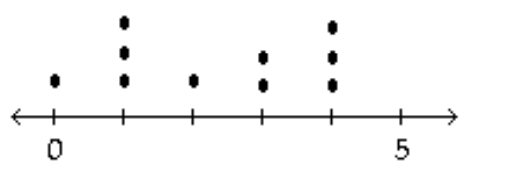
Correct Answer:
Verified
Q72: Construct the dot plot for the
Q73: Construct the dot plot for the
Q74: Construct the dot plot for the
Q75: Solve the problem.
-Wagenlucht Ice Cream Company is
Q76: Solve the problem.
-260 casino patrons, were interviewed
Q77: Construct a pie chart representing the
Q78: Use the data to create a
Q79: Construct the dot plot for the
Q81: Solve the problem.
-Use the high closing
Q82: Solve the problem.
-Use the high closing
Unlock this Answer For Free Now!
View this answer and more for free by performing one of the following actions

Scan the QR code to install the App and get 2 free unlocks

Unlock quizzes for free by uploading documents