Use the data provided in the table below to answer the question. The table shows city size and annual grocery expenditures for eight families. City size is in thousands and expenditures is in hundreds of dollars.
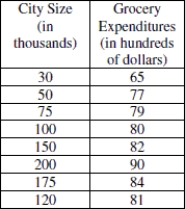
-Using the data from the table, sketch a scatterplot (by hand or with the aid of technology)of the data. Describe any association that you see. Would it be appropriate to fit a linear model to this data?
Correct Answer:
Verified
View Answer
Unlock this answer now
Get Access to more Verified Answers free of charge
Q42: The following regression equation was found to
Q43: Explain in your own words what extrapolation
Q44: Use the following information to answer the
Q45: State the explanatory variable and the response
Q46: If the correlation between whole milk content
Q48: The scatterplot below shows the ice cream
Q49: The following regression equation was found to
Q50: Use the regression equation to predict how
Q51: A horticulturist conducted an experiment on 120
Q52: Use the following information to answer the
Unlock this Answer For Free Now!
View this answer and more for free by performing one of the following actions

Scan the QR code to install the App and get 2 free unlocks

Unlock quizzes for free by uploading documents