The following is a scatterplot of the average final exam score versus midterm score for 11
sections of an introductory statistics class: 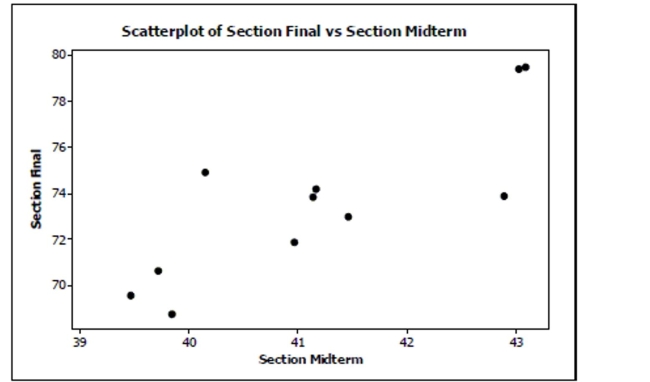
The correlation coefficient for these data is
29. If you had a scatterplot of the final
exam score versus midterm score for all individual students in this introductory statistics
course, would the correlation coefficient be weaker, stronger, or about the same? Explain.
Correct Answer:
Verified
View Answer
Unlock this answer now
Get Access to more Verified Answers free of charge
Q2: Create a model to predict postal rates
Q75: Music and grades (True Story) A couple
Q125: Associations For each pair of variables,
Q127: Storks Data show that there is a
Q128: A common objective for many school
Q129: Breaking strength A company manufactures polypropylene
Q131: Students A growing school district tracks
Q132: Halloween is a fun night. It
Q133: Maple trees A forester would like
Q135: During a science lab, students heated
Unlock this Answer For Free Now!
View this answer and more for free by performing one of the following actions

Scan the QR code to install the App and get 2 free unlocks

Unlock quizzes for free by uploading documents