The following scatterplot shows the percentage of the vote a candidate received in the 2004 senatorial elections according to the voter's income level based on an exit poll of voters conducted by CNN. The income levels 1-8 correspond to the following income classes: Under ; or more.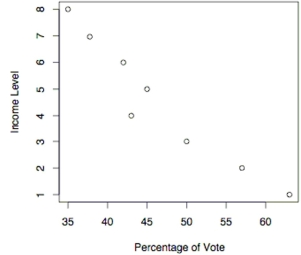
-Use the election scatterplot to determine whether there is a correlation between percentage of vote and income level at the 0.01 significance level with a null hypothesis of
A) The test statistic is between the critical values, so we fail to reject the null hypothesis . There is no evidence to support a claim of correlation between percentage of vote and income level.
B) The test statistic is between the critical values, so we reject the null hypothesis . There is sufficient evidence to support a claim of correlation between percentage of vote and income level.
C) The test statistic is not between the critical values, so we fail to reject the null hypothesis . There is no evidence to support a claim of correlation between percentage of vote and income level.
D) The test statistic is not between the critical values, so we reject the null hypothesis . There is sufficient evidence to support a claim of correlation between percentage of vote and income level.
Correct Answer:
Verified
Q41: Is the data point, P, an outlier,
Q42: Is the data point, P, an
Q43: The following table gives the US
Q44: When performing a rank correlation test,
Q45: Use the rank correlation coefficient to
Q47: Is the data point, P, an outlier,
Q48: The following scatterplot shows the percentage
Q49: Two different tests are designed to
Q50: The following scatterplot shows the percentage
Q51: Construct a scatterplot for the given
Unlock this Answer For Free Now!
View this answer and more for free by performing one of the following actions

Scan the QR code to install the App and get 2 free unlocks

Unlock quizzes for free by uploading documents