The table shows the end-of-the-month checking account balance of a statistics teacher for the months January 1999 through December 1999 as determined by the closing balance on the last banking day of the month. The balance is rounded to the nearest dollar.
Which time series line chart represents the data?
A) 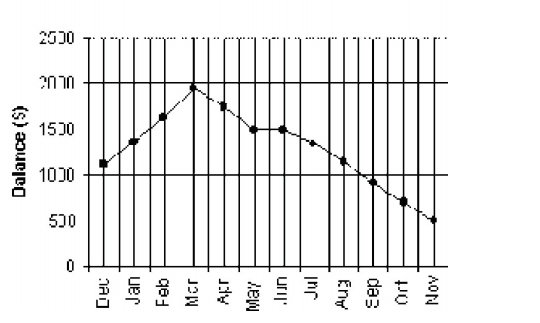
B) 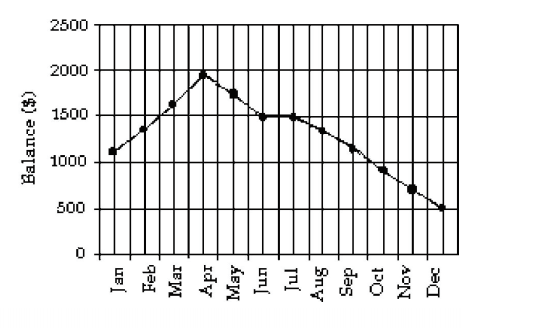
C) 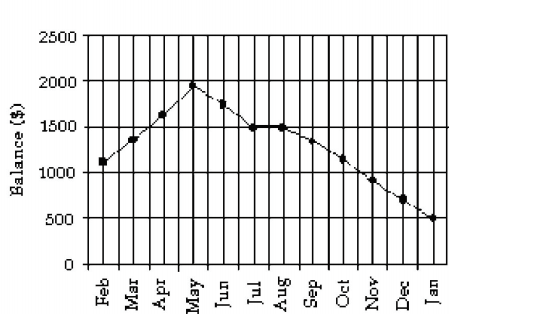
D) None of the above
Correct Answer:
Verified
Q22: A machine is supposed to fill
Q23: Using the graphical display below. Q24: Which line chart below represents the Q25: The data below represent the results Q26: The time series line chart below shows Q28: Over the past 4 years of Q29: Using the graphical display below. Q30: A car dealer is deciding what Q31: States with high deer populations have Q32: The frequency table shows the weights![]()
![]()
Unlock this Answer For Free Now!
View this answer and more for free by performing one of the following actions

Scan the QR code to install the App and get 2 free unlocks

Unlock quizzes for free by uploading documents