The graph shows the enrollment at Riverside Community College for selected years. Use the coordinates of the given points to find the slope of the line. Interpret the meaning of the slope in the 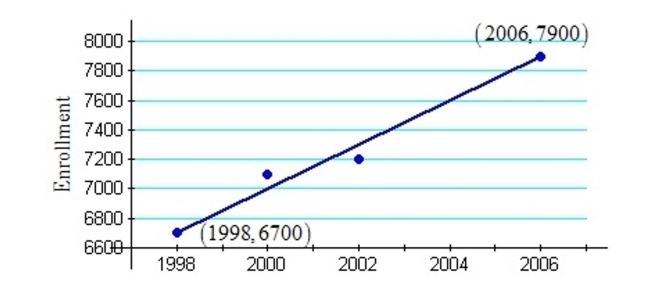 context of this problem
A) m = 300; Enrollment increases by approximately 300 students per year.
B) m = 150; Enrollment increases by an approximate factor of 150 students per year.
C) m = 300; Enrollment increases by an approximate factor of 300 students per year.
D) m = 150; Enrollment increases by approximately 150 students per year.
Correct Answer:
Verified
Q31: A metal mast is stabilized with
Q32: Use the slope formula to determine
Q33: Two points are given from each
Q34: Two points are given from each
Q35: Two points are given from each
Q37: Use the slope formula to determine
Q38: Find the slope of the hill.
Q39: The slope of a line is
Q40: Which of the lines defined here have
Q41: Write an equation of the line
Unlock this Answer For Free Now!
View this answer and more for free by performing one of the following actions

Scan the QR code to install the App and get 2 free unlocks

Unlock quizzes for free by uploading documents