The line graph shows the recorded hourly temperatures in degrees Fahrenheit at an airport. Use the graph to answer the
question. 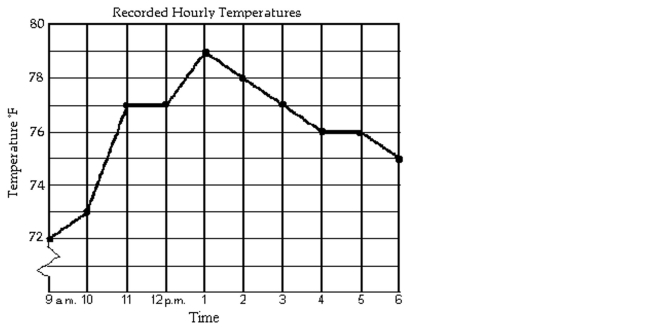
-What temperature was recorded at 10 a.m.?
A)
B)
C)
D)
Correct Answer:
Verified
Q296: Find an equation for the line.
Q297: Provide an appropriate response.
-Determine whether the
Q298: Graph.
-
Q299: Find an equation for the line.
Q300: Find an equation for the line.
Q302: Determine whether the graph is the graph
Q303: Write the word or phrase that best
Q304: Find the domain and range of
Q305: The bar graph shows the expenditures
Q306: Find the indicated function values.
-If
Unlock this Answer For Free Now!
View this answer and more for free by performing one of the following actions

Scan the QR code to install the App and get 2 free unlocks

Unlock quizzes for free by uploading documents