A survey report project in Great Britain estimated that for the years 2000-2005, the total number of bakeries in a particular region would grow according to the linear equation , where is the number of years after 2000. Graph the equation and use the graph to predict the total number bakeries in 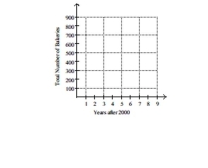
A) 582 bakeries
B) 600 bakeries
C) 560 bakeries
D) 500 bakeries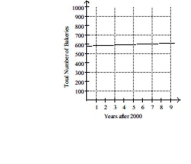
Correct Answer:
Verified
Q85: Graph the linear equation by finding
Q86: Graph the linear equation by finding
Q87: Identify the intercepts. Q88: Graph the linear equation by finding Q89: Graph the linear equation by finding Q91: Identify the intercepts. Q92: Graph the linear equation by finding Q93: Identify the intercepts. Q94: Graph the linear equation by finding Q95: Graph the linear equation by finding Unlock this Answer For Free Now! View this answer and more for free by performing one of the following actions Scan the QR code to install the App and get 2 free unlocks Unlock quizzes for free by uploading documents
-![]()
-![]()
-![]()

