Look at the utility function graphed below and select the type of decision-maker that corresponds to
The graph.
A) Risk averter
B) Risk neutral
C) Risk taker
D) Risk player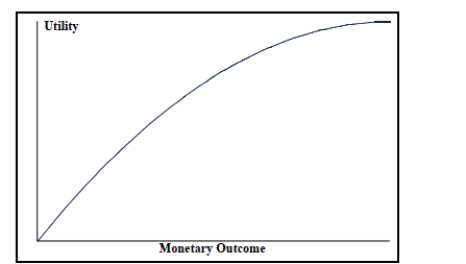
Correct Answer:
Verified
Q65: True or False: To calculate expected profit
Q66: Look at the utility function graphed below
Q66: SCENARIO 20-4
A stock portfolio has the following
Q68: Look at the utility function graphed below
Q68: SCENARIO 20-3
The following information is from 2
Q70: True or False: Opportunity loss is the
Q71: The curve for the will show a
Q73: SCENARIO 20-4
A stock portfolio has the following
Q76: _ is a procedure for revising probabilities
Q78: SCENARIO 20-4
A stock portfolio has the following
Unlock this Answer For Free Now!
View this answer and more for free by performing one of the following actions

Scan the QR code to install the App and get 2 free unlocks

Unlock quizzes for free by uploading documents