Construct and interpret a boxplot or a modified boxplot as specified.
-The normal monthly precipitation (in inches) for August is listed for 20 different U.S. cities. Construct a boxplot for the data.
A) 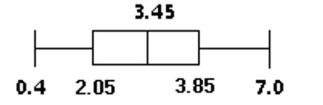
The data is symmetrical. It is a uniform distribution.
B) 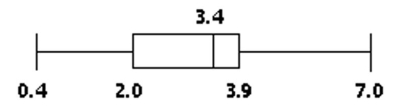
The data is slightly left-skewed.
C) 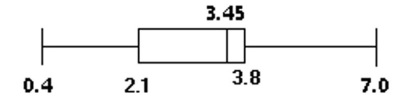
The data is slightly left-skewed.
D) 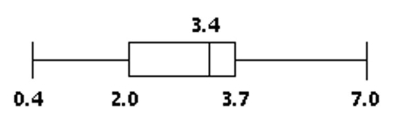
The data is highly left-skewed.
Correct Answer:
Verified
Q127: Obtain the five-number summary for the given
Q128: Find the range for the given
Q129: Obtain the five-number summary for the
Q130: Obtain the five-number summary for the
Q131: Find the sample standard deviation for the
Q133: Find the mode(s)for the given sample
Q134: Use the empirical rule to solve
Q135: Which score has the highest relative position:
Q136: Find the mean for the given
Q137: Find the z-score corresponding to the given
Unlock this Answer For Free Now!
View this answer and more for free by performing one of the following actions

Scan the QR code to install the App and get 2 free unlocks

Unlock quizzes for free by uploading documents